Another way to research a college or a university is to obtain its Common Data Set.
The Common Data Set is a document that was created as a way for schools to address the voracious appetites for higher-ed data from collegiate publishers like US News & World Report and the College Board. Rather than answer every publisher’s annual questions on such areas as freshman admissions, financial aid, merit aid, college majors and acceptance rates, many schools complete this standardized form.
The document is about 30 pages and it’s ugly. Here is a snapshot of the first page of the University of Michigan’s latest Common Data Set. This is the standard look for this obscure yet valuable document.
 Only the most motivated parents are going to pour through these documents and that’s okay because you can find much of the content by checking an institution’s profile on the College Board and COLLEGEdata, as well as other sites.
Finding the Common Data Set
If you would like to take a look at a school’s Common Data Set, the easiest way to find it is by Googling the name of the institution and Common Data Set. If you fail to obtain it that way, Google the school’s name with institutional research. Schools routinely maintain an institutional research section on their website where you may also find other fascinating information about the school.
If you still can’t find the document, it’s probably because the school does not complete the Common Data Set or does not release it publicly.
What’s Inside a Common Data Set
What’s nice about the Common Data Set is that every school uses the same format. Consequently, the layout of Villanova University’s Common Data Set, for instance, will look the same as the CDS of UCLA, Dartmouth, and Georgia Tech and any other school.
The Common Data Set covers these 10 areas:
A. General Information
B. Enrollment & Persistence
C. First-Time, First-year Admissions
D. Transfer Admission
E. Academic Offerings & Policies
F. Student Life
G. Annual Expenses
H. Financial Aid
I. Instructional Faculty & Class Size
J. Degrees Conferred
Common Data Set Highlights
I’ve tried to make pouring through the Common Data Set easier by highlighting what I consider to be important information. So let’s get started.
A. General Information
You’ll find the school’s contact information (see University of Michigan’s above), as well as the type of institution (public or private), and the type of degrees given including bachelors, masters, and doctoral degrees.
Section A4
This is where you’ll find the type of academic calendar that the institution follows. You’ll learn if the school is on the semester, quarter, or trimester system.
How a school organizes its academic year can be important. The class content will be covered more quickly, for instance, if it’s on a quarter or trimester system rather than a semester system. Some students will be able to handle a faster pace and others won’t.
B. Enrollment & Persistence
Section B4 – B11
Look for a school’s graduation rates. You can see how many students graduate in four, five and six years.
As a frame of reference, just 33.3% of students at public universities and 52.8% of students at private institutions graduate in four years.
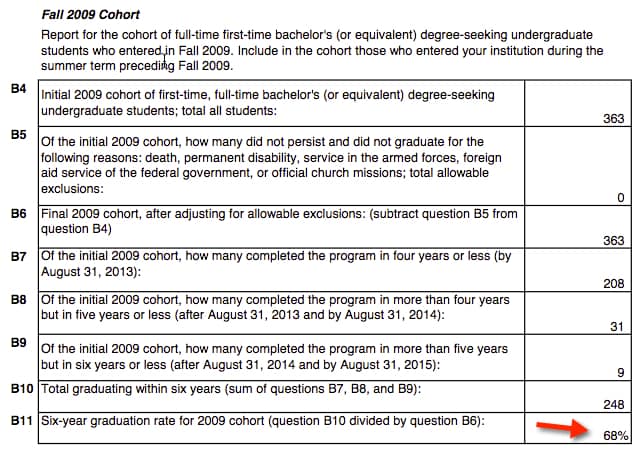
Here are the grad stats for Hampshire College that has lower six-year grad rate (68%) than you would assume considering it is an expensive liberal arts college. In its most latest available Common Data Set, Hampshire used its freshmen class from 2009 to determine its six-year grad rate.
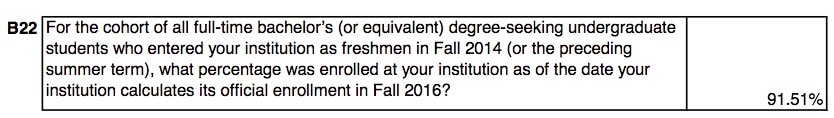
Section B22
Here is where you’ll find the freshmen retention rate, which signifies how many first-year students come back to their schools for sophomore year. Obviously, the higher this rate is the better.
As a general rule, the more selective a school is, the greater percentage of students return as sophomores. There are, however, plenty of exceptions to this rule. Below you’ll find Tulane University’s retention rate:
You can find the ACT’s annual reports on freshman retention rates at different types of higher-ed institutions here:
College Student Retention and Graduation Rates from 2000 to 2015
C. First-Time, First-Year (Freshman) Admission
Section C1
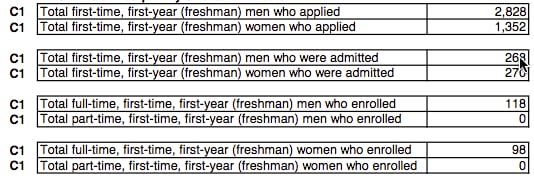
Here’s where you’ll see how many students applied and how many were accepted.
You can get this information in guidebooks and elsewhere on the Internet. What you can’t readily find elsewhere, however, is the acceptance rate broken down by gender. By checking here, you can discover if women or men have an admission advantage.
As you can see from this section of Harvey Mudd College’s Common Data Set, young women have an admission advantage at this engineering/liberal arts school. The acceptance rate for men in the 2016-2017 school year was 9% versus 20% for women. (To get these percentages, you must divide the number of men or women admitted by the number of each gender who applied.
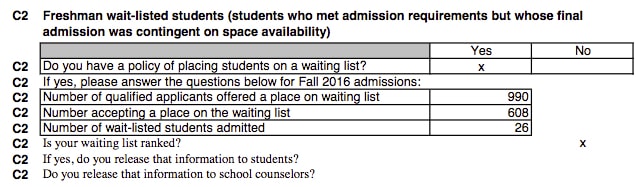
Section C2
If you’re worried about your child getting put on the waiting list, check out this section. You’ll discover if the school uses a wait list and this section also shares how many were offered a spot on the wait list, how many accepted a spot, and how many wait-listed students were eventually admitted. Here are the wait-list stats for Pomona College. You can see 26 applicants for the 2016–2017 school year got off the wait list out of 990 individuals offered a wait-list spot!
Section C7
One of the ways students can increase their chances of getting accepted into a school is to know what admission factors a school cares about.
In this section, each school indicates how important 19 potential admission factors are. A school must put each of these factors into one of the following four categories:
- Very important
- Important
- Considered
- Not considered
Section C7: An Admission Factor Example
This can be an extremely illuminating section to check out when researching what admission factors that a college values. The Common Data Set asks each school to rank 19 admission factors in one of these four ways:
- Very important.
- Important.
- Considered.
- Not considered.
The rigor of a student’s high school record and grade point average are often the most important factors, but there are many others that can come into play. And what’s fascinating is that the admission criteria that schools care about can be quite different.
Below you’ll see how Northeastern University rates the admission categories. Like a lot of very selective schools, it places the utmost importance on the rigor of students’ high school classes, as well as their GPA and standardized test scores.

One factor that’s worth looking at is the very last one – level of applicant’s interest. Many public institutions don’t care if an applicant visits their schools or expresses interest in other ways, but many private institutions do.
Here is an illuminating post from a college admission administrator that you should read concerning demonstrated interest and how schools track potential applicants:
How College Admissions Use Big Data To Track Your Child
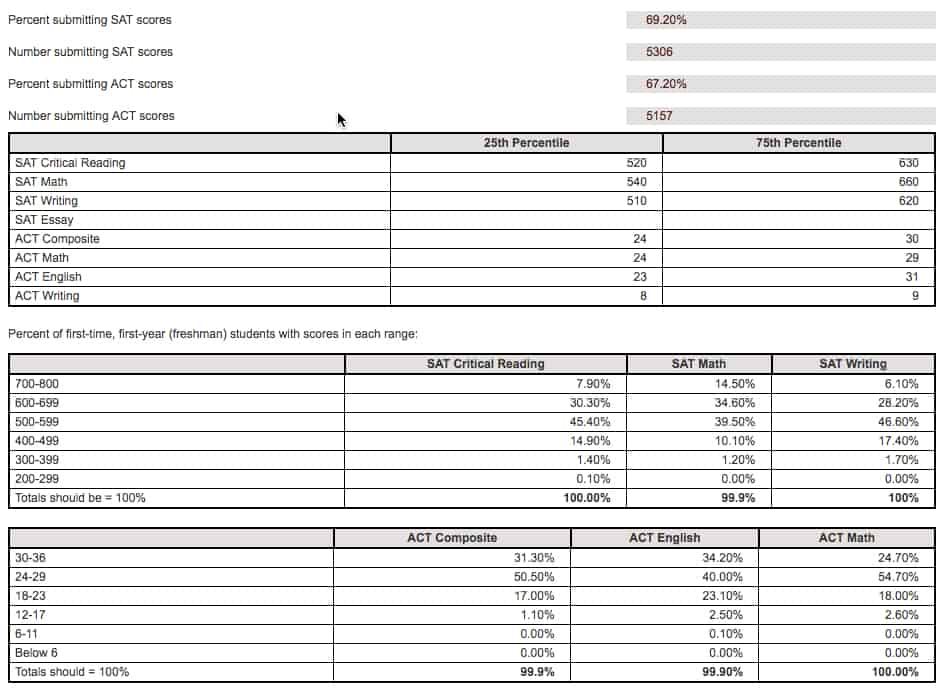
Section C9
In this section you will see a breakdown of the SAT and ACT scores of first-year students. This can give you an idea of whether a child has a realistic chance at a particular institution unless the school is test-optional. This is the University of Indiana’s test stats from the 2016-2017 school year:
Section C10, C11
Here you will find class rank information of admitted students, as well as the breakdown of grade point averages of the institution’s freshmen on a 4.0 scale.
If your client is aiming for the schools at the very top of the rankings heap, it’s typically necessary for a child to be in the top 10% of his or her class. These elite schools want the vast majority of their students to be in the top 10% of their high school class because U.S. News rewards schools that pluck applicants from this limited pool.
As you can see below, 95% of Princeton freshmen graduated in the top 10% of their high school classes. If you’re wondering what students managed to get into Princeton with a lower GPA, it’s undoubtedly the legacies, some minorities, professors’ children, celebrities’ kids and development cases (extremely rich parents who are potential donors).

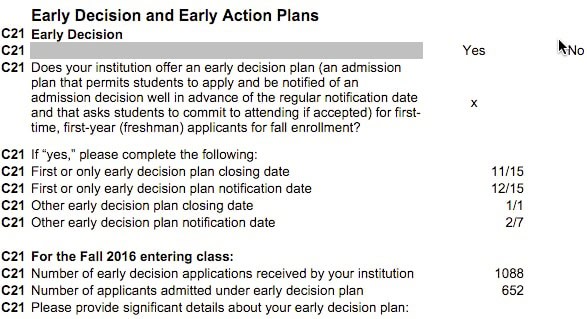
Section C21
If a school offers early decision and early action, this is where you will find out. Checking this section is a great way to determine if applicants who apply early decision or early action enjoy an admission advantage.
Here is a look at Lehigh University’s ED/EA section of the Common Data Set. Lehigh accepted nearly 60% of the students who applied Early Decision for the 2016-2017 school year. In contrast, Lehigh’s overall acceptance rate was just 26% so clearly applying ED provides qualified students a significant advantage.
D. Transfers
It’s an unfortunate reality that roughly one in three students who start at four-year colleges end up transferring. This section allows individual to discover what it takes to transfer to a particular institution.
You can see a portion of this section of the University of Tennessee’s Common Data Set below.
Other information on transfers that you can obtain from this section include:
- Maximum number of credits that can transfer.
- Lowest grades that can transfer.
- Minimum credit that can transfer.
- Minimum credits must earn to graduate with a bachelor’s degree.
Some universities will also include a link to further information about their transfer policy.
![]()
E. Academic Offerings and Policies
Section E1, E2
In this brief section, you can learn if the school allows double majors and supports such offerings as honors program, coops, study abroad and honors programs. This section also reveals whether most students will have to take courses in different fields such as foreign language, which will be a deal-breaker for some teenagers.

F. Student Life
Section F1
This section contains the percentage of students who come from outside the state. It can make for a more enriching educational experience if there is a healthy percentage of students coming from elsewhere.
You’ll also find the percentage of women and men who join fraternity and sororities. There have been some disturbing investigative pieces in recent years in the media about fraternities:
The Dark Power of Fraternities
Confessions of an Ivy League Frat Boy: Inside Dartmouth’s Hazing Abuses
G. Annual Expenses
Section G1 and G
You will learn what the tuition and room/board sticker price. Remember that sticker prices are often irrelevant because the majority of students receive some type of scholarships or grants.
In Section G5, you will see the school’s estimates of books/supplies, transportation, and other expenses. You should know that some schools provide realistic estimates and others low-ball the figures.
H. Financial Aid
H2
This is a critically important section that helps you assess whether a school is typically generous to students who require need-based aid. This section will also reveal whether the school provides merit scholarships to affluent students and also how many receive the award.
To walk you through this, I am using the College of William and Mary. The first column represents freshmen and the second column represents all undergraduates.

Section H2(c)
Look at H2(c) – the number of students who have financial need and compare that to H2(d) – the number who received any assistance. Ideally these two figures will be the same.
Section H2(e)
Next look at H2(e), which reveals the number of freshman who receive scholarships or grants (free money). In this case, 455 students were awarded financial aid, but only 328 received grants or scholarships. At the most generous schools, everybody who qualifies for financial aid will receive a scholarship or grant. That’s the gold standard.
Section H2(h)
This is another critical number. This tells us how many students had their full financial need met. The financial aid formula (usually the Free Application for Federal Student Aid) determines a student’s financial need. Ideally every student who had financial need, will have their full need met. In reality, it’s the nation’s most elite schools that can pull this off.
In this case, William and Mary provided the full need for 102 freshmen or 22% of the 455 freshmen who received financial aid.
Section H2(i)
I circled this figure that reveals what percentage of need a school typically meets when creating financial aid packages. It’s rare to find a public school that provides 100% of need and once again the private institutions that meet 100% of need are, with some exceptions, the elite ones.
Also check the percentage of need met for freshmen versus all undergraduates in the right-hand column. Some schools drop their support after freshmen year as they bet that students wouldn’t want to leave even if their aid support drops. At William and Mary, the need met actually increased slightly after freshman year.
H2(k) Take a look at the average scholarship/grant that a school provides. In this case, the typical need-based award is $13,037.
H2(l) and (m)
I wouldn’t pay much attention to these sections. Self-help can refer to loans and/or work-study. As for average need-based loans, the vast majority of schools in this country will insert the maximum federal direct student loan into a student’s aid package. For freshmen, the maximum federal direct student loan is $5,500.
H2a Non-Need Based Scholarships and Grants
If you will not qualify for need-based aid, this section is extremely important.
This is the section that reveals how many affluent students receive merit scholarships and the average amount.

At William and Mary, 43 freshman received merit scholarships worth an average of $6,948.
H2A Athletic scholarships
H2A(p) and (q)
Here is where you will find how many students, who don’t need financial help, received athletic scholarships along with the average amount. Seventy-three students received athletic scholarships worth an average of $21,599.
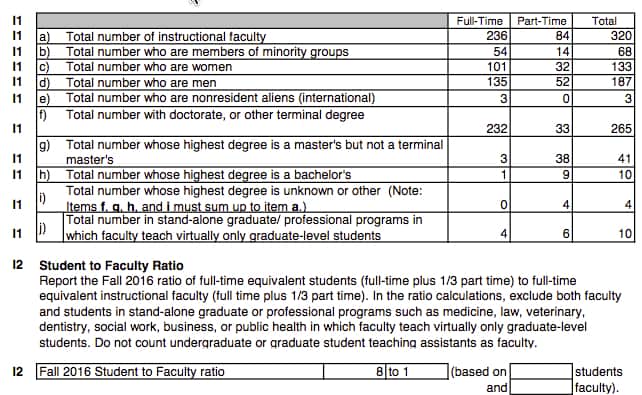
I. Instructional Faculty and Class Size
I1 and I2
This is the section of a Common Data Set that shares how many instructors work at an institution and what type of degrees they hold. It also includes the student-faculty ratio. Keep in mind that this ratio can be misleading because they can include faculty that don’t teach undergrads while including graduate students who teach undergrads.
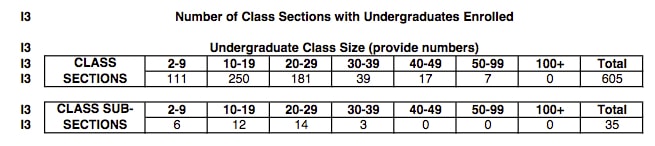
I3 Undergraduate Class Size
This section will give you an idea about class size at an institution. This snapshot comes from the CDS of Trinity University in Texas. As you can see this private university does not have any classes with 100 or more students.