During this course, I’ve been encouraging families to consider casting a wider net when searching for promising schools and
In this lesson I am sharing resources to help families broaden their searches and to evaluate the schools on their lists. I am eager to hear about other resources that you like and have used. I’d love for you to share them in the comment section below so I can build on this resource list.
In addition to the resources that you’ll find below, I offer a few more in A Guide to Building a Perfect College List. I’ve provided the link here and you can also find it in the Bonus Material module.
I am covering some of these online resources – College Board, COLLEGEdata, College Navigator – in more detail elsewhere in the course. I am sharing the following resources in no particular order:
College Completion

With funding from the Gates Foundation, The Chronicle of Higher Education created the College Completion microsite within the highly respected publication’s website that includes a wide variety of graduation statistics for schools. On this free site you can create custom peer groups to compare colleges and sort individual private and/or public schools by state and graduation rates.
To give you an idea of what you’ll find, here is a screenshot of a partial list of public colleges and universities I generated with the highest four-year grad rates, which is identified as “Graduation rate 100%” in the right-hand column. The other column refers to six-year grad rates, which the federal government (the source of these figures) expresses as 150% of the traditional grad rate.

Here is a screenshot of the private schools with the top four-year grad rates:

Of course, the schools at the top of these lists will be among the best known for families looking for elite schools. Scrolling further down through the names on the lists that you generate will elicit many more ideas. You can also flip the lists and sort schools by ascending grad order.
The website also lets you create charts of schools in individual states. Here is a screen shot of some public universities in California, which reveals poor four-year grad rates, as well as other statistics about the schools. The only state school with an above average grad rate on this chart is California Maritime Academy, a specialized maritime school where students wear uniforms and spend a lot of class time on ships.

It’s been our experience that families often fail to look at graduation rates when exploring schools even though failing to graduate in the traditional four years can be incredibly costly.
According to federal statistics, just 33% of full-time students attending four-year public colleges and universities graduate in four years while only 52.8% of students at private institutions manage to do this.
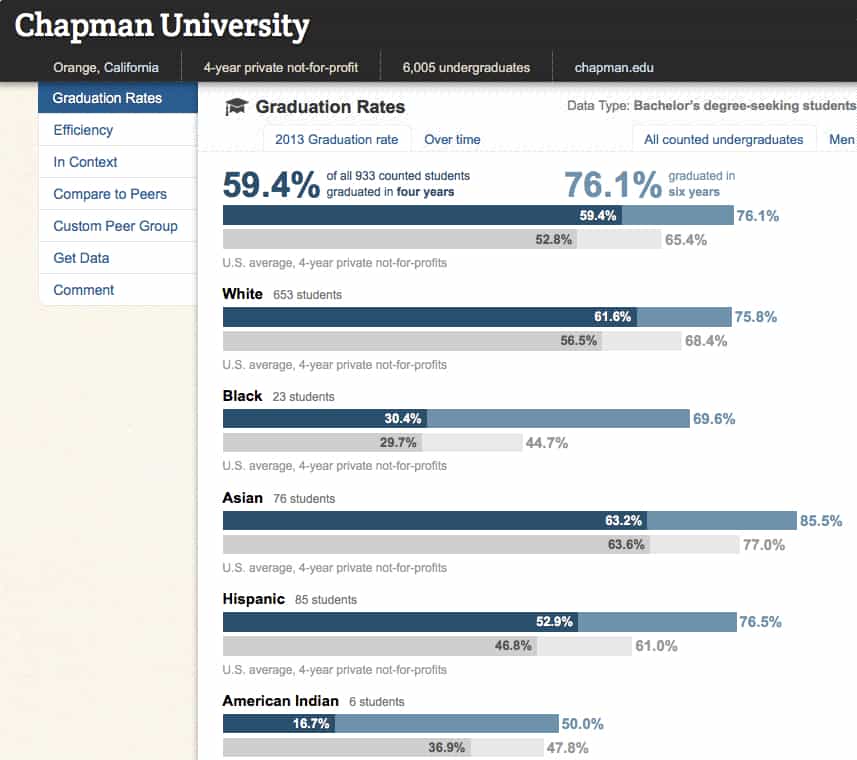
On College Completion, you can also check the grad rates of an individual school that’s broken down by gender and ethnicity. Here is screen shot of four and six-year grad rates for Chapman University, an expensive school in Southern California that has become hot despite an underwhelming four-year grad rate:
College Results Online

College Results Online, which belongs to The Education Trust, provides similar information to what you’ll find on College Completion. One of the features that I like on this site is the ability to find schools that are similar to each other. To create a list, you must first call up the profile of a school and then click the Similar School button.
I am using Bradley University in Peoria, IL, as an example. Below you’ll see a portion of the information College Results Online provides for Bradley U. and at the top you’ll see a red arrow pointing to its Similar Colleges link.

When I clicked the Similar Colleges link, the site generated a list of peer institutions based on 12 institutional and student characteristics. You can adjust the grad time frame to four years, which is what I did. I also instructed the software to provide 25 similar schools rather than the 15-school default list.
Highlighted in yellow, you will also see the categories in which to sort Bradley U’s peer schools in addition to grad rates. I selected the Admissions category.

Here is the partial list of schools similar to Bradley U. generated with the above parameters. There are many more columns of statistics than what you can see here:

College Results’ Advanced Search Feature
When hunting for schools, I’d also urge you to play around with the site’s Advanced Search feature. (See below.) With this tool, you can direct the software to find schools based on your criteria. You’ll find the tab in the upper right hand corner of the website:

You can learn more about how to use the Advanced Search function by reading one of my blog post:
Getting Ideas for a College List
CollegeMeasures.org

CollegeMeasures.org, which has also received funding from the Gates Foundation, has been working with states to provide ACTUAL salary data for new college grads at the university and college major level. CollegeMeasures now has accurate, verifiable data on overall salaries of new graduates by schools and majors in six states. Here are the states with the corresponding links, where you can find this valuable salary information:
Taken as a whole, the data from the six states show that strong earnings are definitely not automatically tied to the most prestigious campuses in a state. In Colorado, for instance, the average first-year, median earnings of graduates of Colorado School of Mines ($56,671), Regis University ($53,705), University of Colorado-Denver ($43,804) and the University of Denver ($39,094) were greater than the state’s flagship institution – the University of Colorado at Boulder ($37,735).
When looking at Texas data, I randomly picked a non-prestigious state school — Sam Houston State University – to compare to the University of Texas at Austin, the highly regarded flagship in the Lone Star State. I checked three majors and the Sam Houston grads were earning more in each category — biology, business, and journalism. Journalism grads at Sam Houston State University, for instance, were making $32,079 a year versus $30,361 at UT Austin.
If you looked at the Virginia data, you would discover that business majors at the University of Richmond were earning more than grads of all other Virginia schools including Virginia Tech and the University of Virginia.
This real data can serve as a powerful tool when convincing students or parents that the small percentage of schools that ambitious students think are the only ones worth attending is erroneous. When families have real data to make decisions rather than relying on dubious college rankings, it will be easier for them to make far more intelligent decisions.
Researching Schools in Other States
Even if you aren’t interested in schools in the six states that have available state data, CollegeMeasures.org provides many other opportunities for families researching schools across the country. We’re going to share an example of one of the research tools on the site:
On CollegeMeasure’s home page, I’m clicking on the Four-Year College Data Tool.
![]()
I was directed to a page (see below) that allows me to find statistics in a variety of ways:

I clicked on View Performance by College and this is what I saw:

In this section of CollegeMeasures, I can filter schools by individual states, groups of states or the entire U.S.. You can also designate whether you want to look at private or public schools. I can even search by flagships or land grant schools, as well as by searching in-state and out-of-state tuition.
In the above search field, I will also be asked to Select a Measure. Here are my options from that drop-down menu:

To illustrate what you can find, I looked at private and public institutions in Michigan, Wisconsin and Minnesota and sorted them by their freshmen retention rates. (The higher the retention rate, the better.) Here are the schools at the top of the list that I generated:

If I wanted to sort schools by pay, I could check the last category in the drop-down menu: Median Starting Pay for Recent Graduates. Since actual state data is not available for many states, CollegeMeasures uses PayScale.com figures. Another category worth checking out is the Instruction Cost per Student.
In the example below, I ranked schools in New York, New Jersey and Connecticut by beginning grad salaries:

There are many ways to use CollegeMeasures and I’d suggest you try playing around with the site.
College Board’s Big Future

Big Future is a great site to research schools and I particularly like the College Board to get a quick snapshot of whether a school is typically generous with need-based financial aid and/or merit scholarships. Since I devote an entire lesson to the College Board, I just want to mention it here.
You can learn more about how to use the College Board’s website in the lesson within the module entitled, Tools to Find Generous Colleges.
I wrote the post that discusses how you can use the College Board’s search engine to look for schools by percentage of financial need met:
9 Steps to Finding the Most Generous Colleges
COLLEGEdata

COLLEGEdata provides tons of information about individual schools in such areas as financial aid, majors, admission factors and more. This is one of the tools that I discuss in detail in another lesson this week – COLLEGEdata: Looking for College Money.
COLLEGEdata is a handy resource when checking on a school’s financial aid and merit scholarship practices. The site has much of the same information that you’ll find on the College Board, but it includes one important statistic that the College Board omits — the number of students who receive merit scholarships. The College Board only shares what the average merit scholarship amount is and not how many students receive it. That number, however, is important to know for affluent children who want to know what the odds are of receiving a merit scholarship.
I am using Rice University to illustrate what you can find in the Money Matters section of a school’s profile on COLLEGEdata. The layout is ugly, but the data is valuable. If you look at Rice’s stats, you will see that 100% of financial-aid recipients have their full need met. That’s excellent. The second arrow shows that nearly 16% of the students at Rice, who happen to have no financial need, received a merit scholarship.
I used Rice in this example because it is a highly rated university in U.S. News’ college rankings and yet it provides merit scholarships. Most of the most highly rated institutions don’t provide these merit awards or limit them to a small group of students. Two other Southern universities – Vanderbilt and Emory are also notable exceptions.

Bait-and-Switch Colleges
You can also use COLLEGEdata to spot bait-and-switch schools. When parents look at colleges they assume that whatever financial aid they receive during their child’s freshman year will remain the same for four years as long as their financial situation doesn’t change.
In reality, however, some schools offer the best packages to high school seniors who are often shopping for the best deal. Once the students have gotten settled in, the schools offer subsequent packages that are stingier. Schools figure, “Hey, is this kid really going to leave if I shave a few thousand dollars from his package?”
An easy way is to check an institution’s financial aid track record is to head to a school’s Money Matters section and compare the average percent of need met for freshmen and the average percent of need for all undergrads.
When I checked out American University’s track record, I was shocked at how much the financial support dropped for students after their freshmen year – from 82% down to 61%!

Center for College Affordability and Productivity (Forbes College Rankings)

This education think tank created the methodology for Forbes college rankings, which exists in the shadows of US News rankings. I think these rankings are a better measure of schools. All college rankings, however, are flawed and I argue that they should be used as a way to explore a wider group of schools. Thinking of the rankings as tip sheets can be especially helpful when exploring liberal arts colleges and master’s level universities since they don’t have the visibility that many doctoral-level universities enjoy.
On the center’s website, you can look at Forbes’ annual rankings going back to 2008. As you can see in the screen shot below, the site has sliced and diced the Forbes rankings in a variety of ways. You can download all of the lists as PDF’s.

If you want to drill down further, check out the site’s Component Rankings. It will show you the scores for each of the components including the freshmen retention rate, the graduation rate and the predicted graduation rate and alumni receiving PhD’s. You will also see a school’s rank linked to new grads’ salaries based on PayScale.com records. And you’ll discover how the students ranked their professors via RateMyProfessor.com (RPM Rank). Here is a snapshot of some schools I saw in the component breakdown:

Click on this methodology link to learn how the rankings are tabulated for each category. In the snapshot above, Carleton College, a liberal arts college in Minnesota, was ranked 7th among all 650 schools for its high professor ratings via RateMyProfessor.com (RMP). Case Western Reserve had the worst professor ratings followed by Catholic University. Carnegie Mellon and Case Western Reserve, two major engineering schools, were ranked 9th and 35th respectively on PayScale salaries.
Do-It-Yourself College Rankings

This website belongs to Michelle Kretzschmar, who is a friend of mine. She created it because of the limitations of most college data sources. The DIY College Rankings Spreadsheet contains data from the U.S. Department of Education, and specifically something called the Integrated Post-secondary Education Data System (IPEDS), on over 1,500 schools. The spreadsheet includes over 200 variables, including graduation rates and percentage of students receiving grants from their schools.
You can also download for free the 50-50 List of over 400 schools that accept at least 50% of students and have at least a 50% graduation rate, an excellent place to start searching for schools for B students. She also offers a class where she explains what you can get out of this search tool.
College Navigator
College Navigator is a massive federal depository of information on thousands of colleges and universities that allows you to search for schools based on such criteria as location, majors, and types of institutions.
To generate a list of schools in a particular major, head to the College Navigator’s home page. Here’s what you’ll see:

When you’re on the site, look on the left hand side and click on the rectangle that says Browse for Programs.

In this case, I typed in nursing, which produced lots of different nursing majors. You must click the +add button to include the majors in your search.

To narrow your search you can designate that you want public or private schools and two-year or four-year schools. In my search, I selected private non-profit and public universities. You can also narrow your search by focusing on certain states. To choose by states, click on the Use Map icon. In this example, I selected 8 states in the Midwest. Yellow pins on the map designate the states that I picked.

Based on my criteria, I ultimately obtained a list of 160 Midwestern schools that have nursing programs. By clicking on each school’s hyperlink, you will find lots of information about the institution. Here is the beginning of the list of Midwestern nursing schools:

You can winnow down the list of schools further by using the options you’ll see below:

Bottom Line: You can find college and universities that offer any college majors that you are interested in by using the federal College Navigator. So check it out!
College Reality Check

College Reality Check is another site courtesy of The Chronicle of Higher Education that allows families an easy way to compare schools on one screen with such factors as net price, graduation rates, student loan default rate, and estimated average monthly loan repayment obligations.
You can compare up to five schools at one time and I am sharing with you a couple of examples that illustrate the net prices of different schools. Net prices can vary dramatically among institutions.
Keep in mind that the average net prices on this site, which come from the federal government, are for income ranges. Unfortunately, the highest income range is only $110,001 and above, which is not helpful because what a family with a household income of $110,000 can afford will be quite different than what a millionaire can cover.
In the example below, I obtained the average net price for families whose income ranges between $48,001 and $75,000. As you can see, the prices for students applying to these schools differ significantly.
I included Carroll College in Helena, MT, to illustrate what I’ve been saying in this class. Lesser-known schools in areas off the coasts are often less expensive. One of this school’s many selling points is its nursing school where students can graduate in four years unlike impacted nursing programs in state schools in California.
The example below also shows that expensive schools with excellent financial aid (Pomona) can be cheaper than state universities. It also shows how outrageously stingy Santa Clara University is, followed by Loyola Marymount University.

I also generated a net-price example with East Coast schools. In this example, I assumed that the family’s income was between $75,001 and $110,000. Once again you’ll see that the prices differ significantly.

CollegeXpress
You can generate lots of ideas on the CollegeExpress website. You can get a flavor of the lists by looking at the screen shot below.

 Most of the lists that you’ll find on CollegeXpress come from a 520-page book called The College Finder by Steven R. Antonoff, a highly regarded educational consultant from Denver, Colorado.
With the exception of a short narrative at the beginning of the book, The College Finder is strictly stuffed with lists. The lists are a product of Antonoff’s research, the input of countless other higher education professionals, and student user suggestions. No one pays to be on these lists.
Unigo
Unigo is a repository for student reviews of their schools. The reviews can be unvarnished and quite illuminating.
Families and consultants can look on Unigo to see what students have said about individual schools. Keep in mind, however, that there will be far more reviews from students attending popular schools. For instance, New York University recently had 410 student reviews while Marquette University had 154 reviews and Illinois Wesleyan University had zero.

School websites
You can learn a lot just by poking around these websites. Don’t just stop at the pages intended for prospective students. Dig deeper and visit the web homes of academic departments. Take a look at the course listings to see what is actually offered each semester. Make sure you take a look at the school’s Institutional Research page where they park all sorts of interesting data. Few do as good a job as St. Olaf College in Minnesota, which shares graduation outcomes, its Collegiate Learning Assessment scores, its results from the National Survey of Student Engagement and more.
College search engines
There are lots of websites that contain college search engines. They include Student Advisor, Princeton Review and Petersons. Michelle did a comparison of eight college search engines at College Search Websites.
College Navigator: Checking a College’s Generosity
College Portrait of Undergraduate Research

You’ll find information on more than 300 public universities and colleges on this site. College Portrait provides basic information about schools and also shares data from the National Survey of Student Engagement.
U-CAN: University and College Accountability Network

U-CAN is a similar consumer site for more than 800 private institutions that’s sponsored by the National Association of Independent Colleges and Universities. The site would have been more helpful if it included learning outcomes and results from the National Survey of Student Engagement.
Hi Lynn,
For public universities, do you know where I might find info on acceptance rates for in-state students vs. out-of-state students? Thank you!
Kristin
Author
Hi Kristin,
Unfortunately, I don’t know of any public source of this information. I’d suggest contacting individual schools and asking them this question.
Lynn O.
Is there any place to find statistics on programs like the U of Maryland Meyerhoff program? Can you find admittance rates, retention rates, graduation rates etc. of these types of programs anywhere? Can you see what your odds are of getting in statistically speaking before applying?
Author
Hi April,
Official retention rates and graduation rates are calculated for the federal government for an entire institution.
What I would do is ask whoever is a point person at the honors college at U of Maryland in Baltimore and/or the admission office about the statistics that you are asking about. I would think that the honors college would collect these kinds of statistics. Surely, the honors program at this school and any other honors college would be able to tell you what the requirements are for admittance. Unfortunately, I think you are going to do research for each honors college.
Lynn O’Shaughnessy
Hello Lynn –
How are you today? I have two questions for you
1. I am looking for a story you mentioned in your webinar about how to rsch academic depts. at different schools.
2. You also mentioned a website that I didn’t get the name of….. this website provides actual beginning salaries by major and college if you clicked on the Counselor & Consultants tab.
I am not sure I am posting this question in the best place.
Thank you,
Carolyn
Hello Lynn–what would you consider to be a minimum reasonable 4 year graduation rate? 60%? 70%? 80% none of the above? Thank you! Carol
Hi Carol,
In general, the more selective the school is, the higher the graduation rate. Somebody with a 3.6 GPA isn’t going to get into schools with the best grad rates. What is more relevant is looking at schools where a child has a decent chance of admission and compare the grad rates of those schools. Among schools with similar demographics, there can be significant differences in graduation rates. Also check the freshmen retention rates of schools, which also will have a significant impact on graduation rates.
Lynn O.
Hi Lynn
I am helping a young lady (family friend) who is Latina and first gen and was just accepted at BU, her dream school. She was offered very generous aid about $47,000 in grants, a Perkins loan, Stafford loan (subsidized), work study, and 2,000 in unsubsidized Stafford.
However, I just read your section on bait and switch schools and I see that the percentage of students whose need is fully met drops from 37.2% for freshmen to 28.8% for all undergrads and the average need based gift drops from $34,000 for freshmen to $30,000 for all undergrads
I haven’t seen the details of the award yet. For example, I don’t know if she has to maintain a certain GPA to continue to get merit aid after freshman year. I”m also waiting to see her UC Santa Cruz award and she hasn’t heard from UCSD or Berkeley yet.
Any words of wisdom as to how I should advise this student?
Thanks very much.
Lynn, Hello. Will the 4 year graduation rates also reflect drop outs or are those numbers removed from the calculation? Thank you.
Hi Robert,
The graduation rates that you see are from the federal government and the feds calculate grads rates by including students who dropped out or who transferred elsewhere. Consequently, the grad rate of those who stick it out will be higher than what the graduation rate would suggest.
I should mention that this way to calculating rates is controversial and is going to be eventually changed.
Lynn O.
Hi Lynn,
I have a question about a college that my daughter has been excepted to. It is her first choice pick but we are weighting all of our options. Northeastern University. They do not list a graduation rate on the college data site.
Also I am concerned that it might be a “bait and switch” college. What are your thoughts ?
HI Tracy,
Northeastern has a co-op program so no one graduates in four years. The minimum is five years.
You need to also keep in mind that Northeastern is very expensive because the school is located in a popular city on the East Coast. I believe Northeastern is among the top 10 in terms of private schools attracting the most applications. I wouldn’t be surprised if the award your daughter receives will be small.
If you haven’t already, I’d run the net price calculator on this school.
Lynn O.